WEB端显示三维地形模型

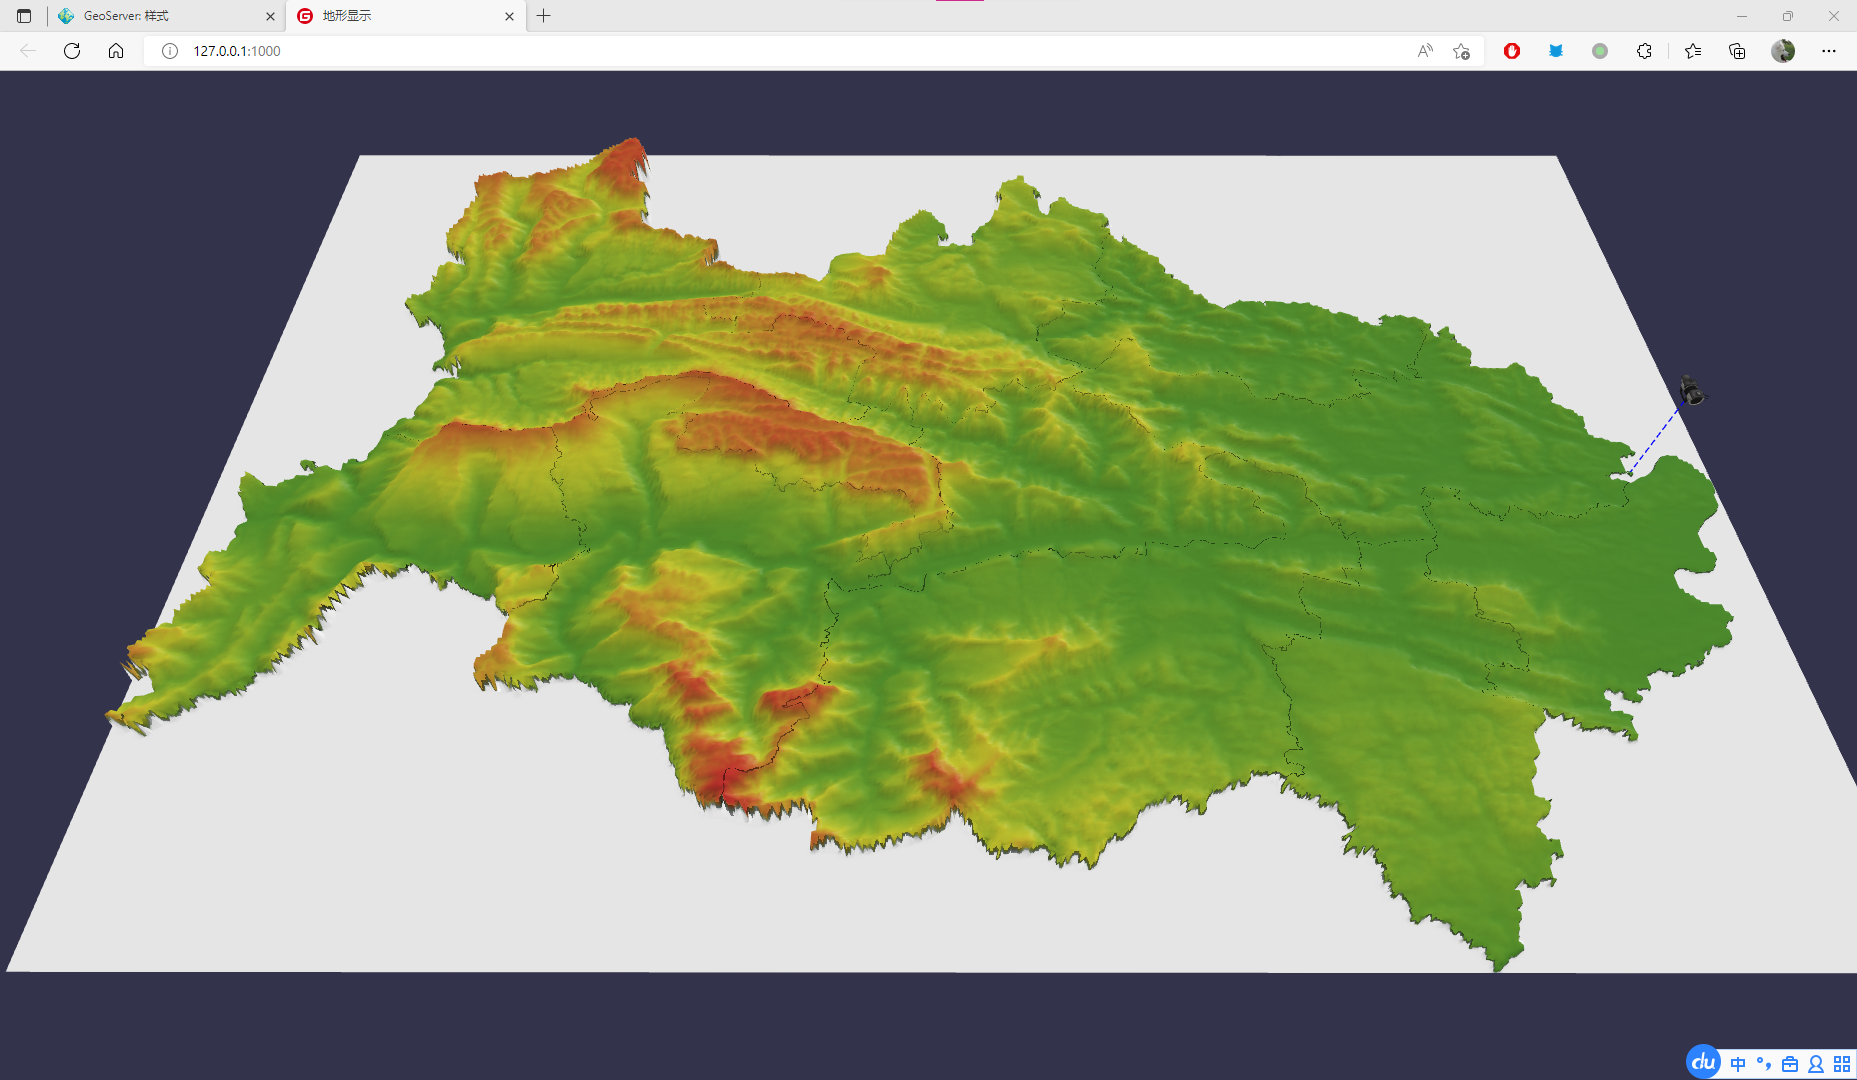
注:正常在WEB上显示三维地形首选Cesium,本文内容仅作为研究,展示文章用DEM制作通用三维地形模型中制作的局部三维地形模型

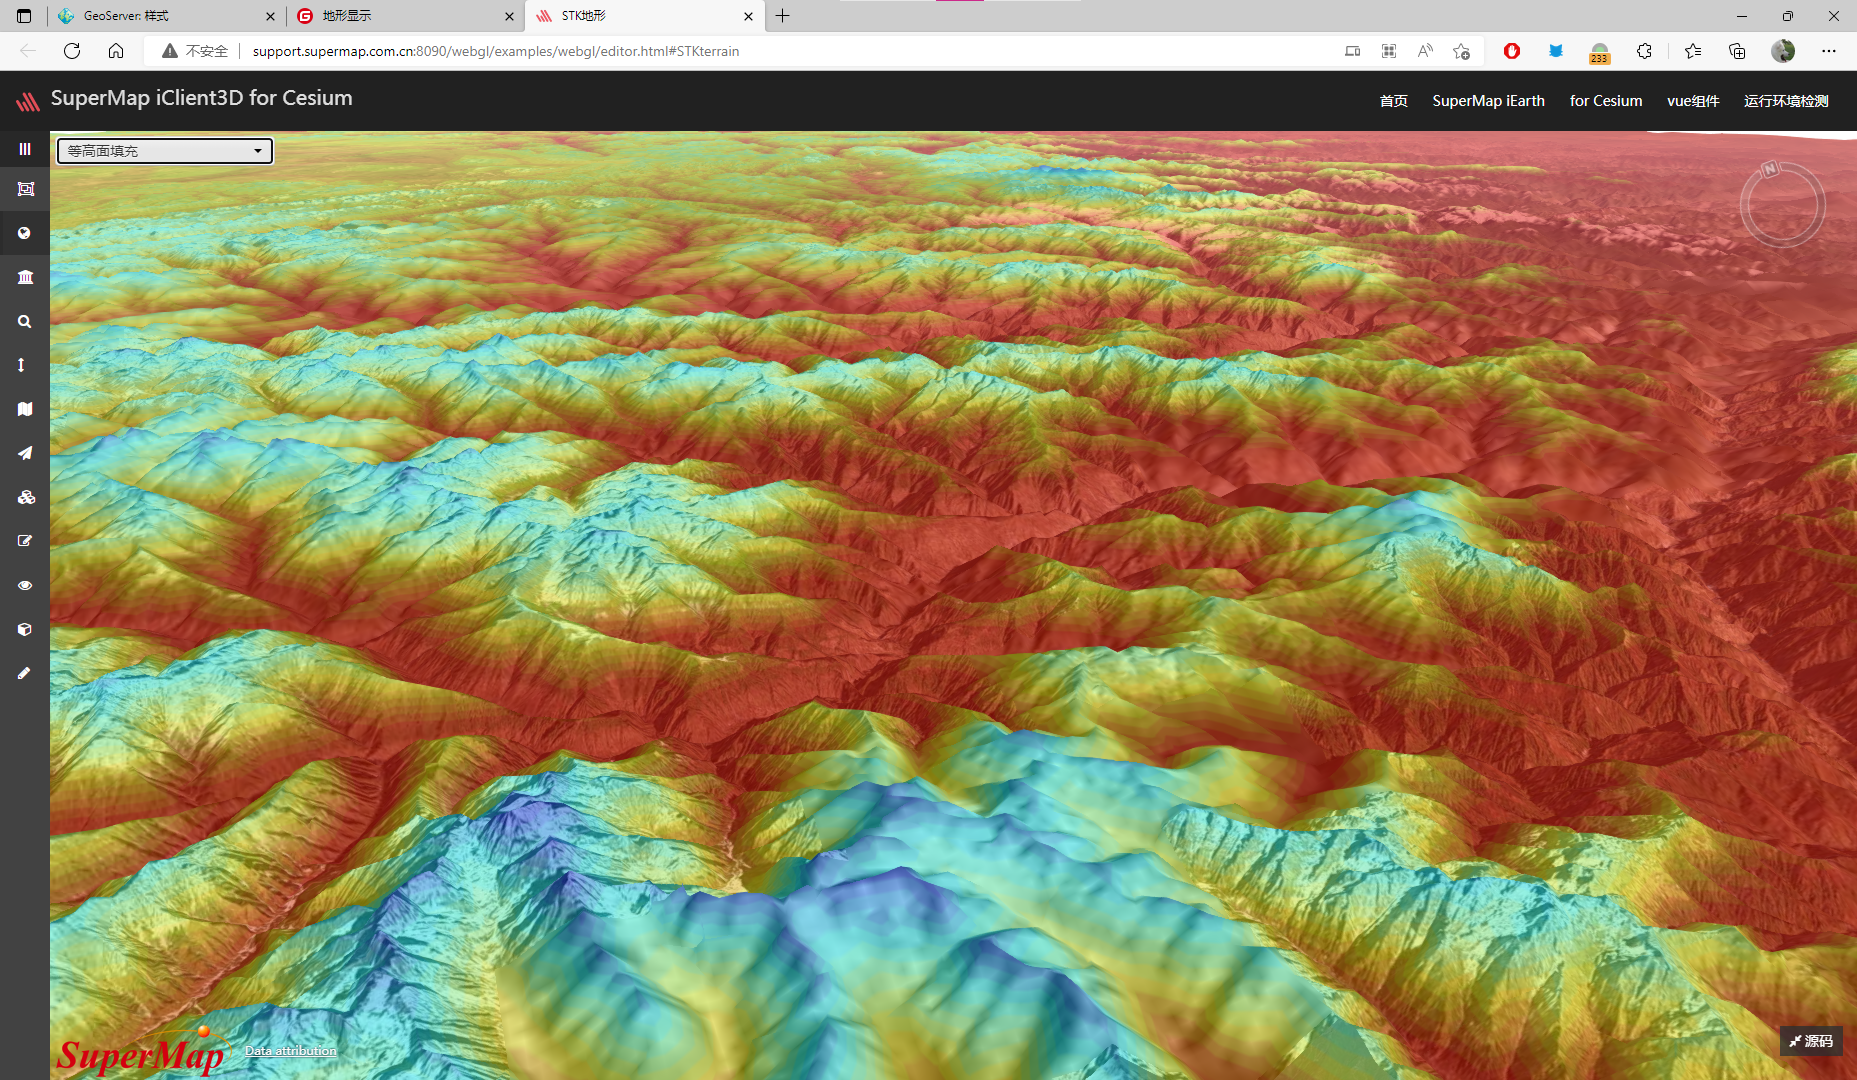
Cesium是可以很容易的实现在WEB端三维地形的,下面的图是分别是使用基于Cesium的Mars3D和超图的iClient3D出来的效果。不过Cesium终究是基于地球的,比较适合大块区域的展示。和文章用DEM制作通用三维地形模型里做的模型效果来比,还是差点意思,资源占用也很高。加上因为三维模型都是笛卡尔坐标系,我们在制作模型的时候也使用了高斯克吕格投影坐标系,直接整个模型加到球形的Cesium里再缩放到一个县的范围那么大,必然是不能处处对应准的,所以那篇文章的成果就不太适合用Cesium展示了。
Mars3D实现效果
SuperMap iClient3D实现效果

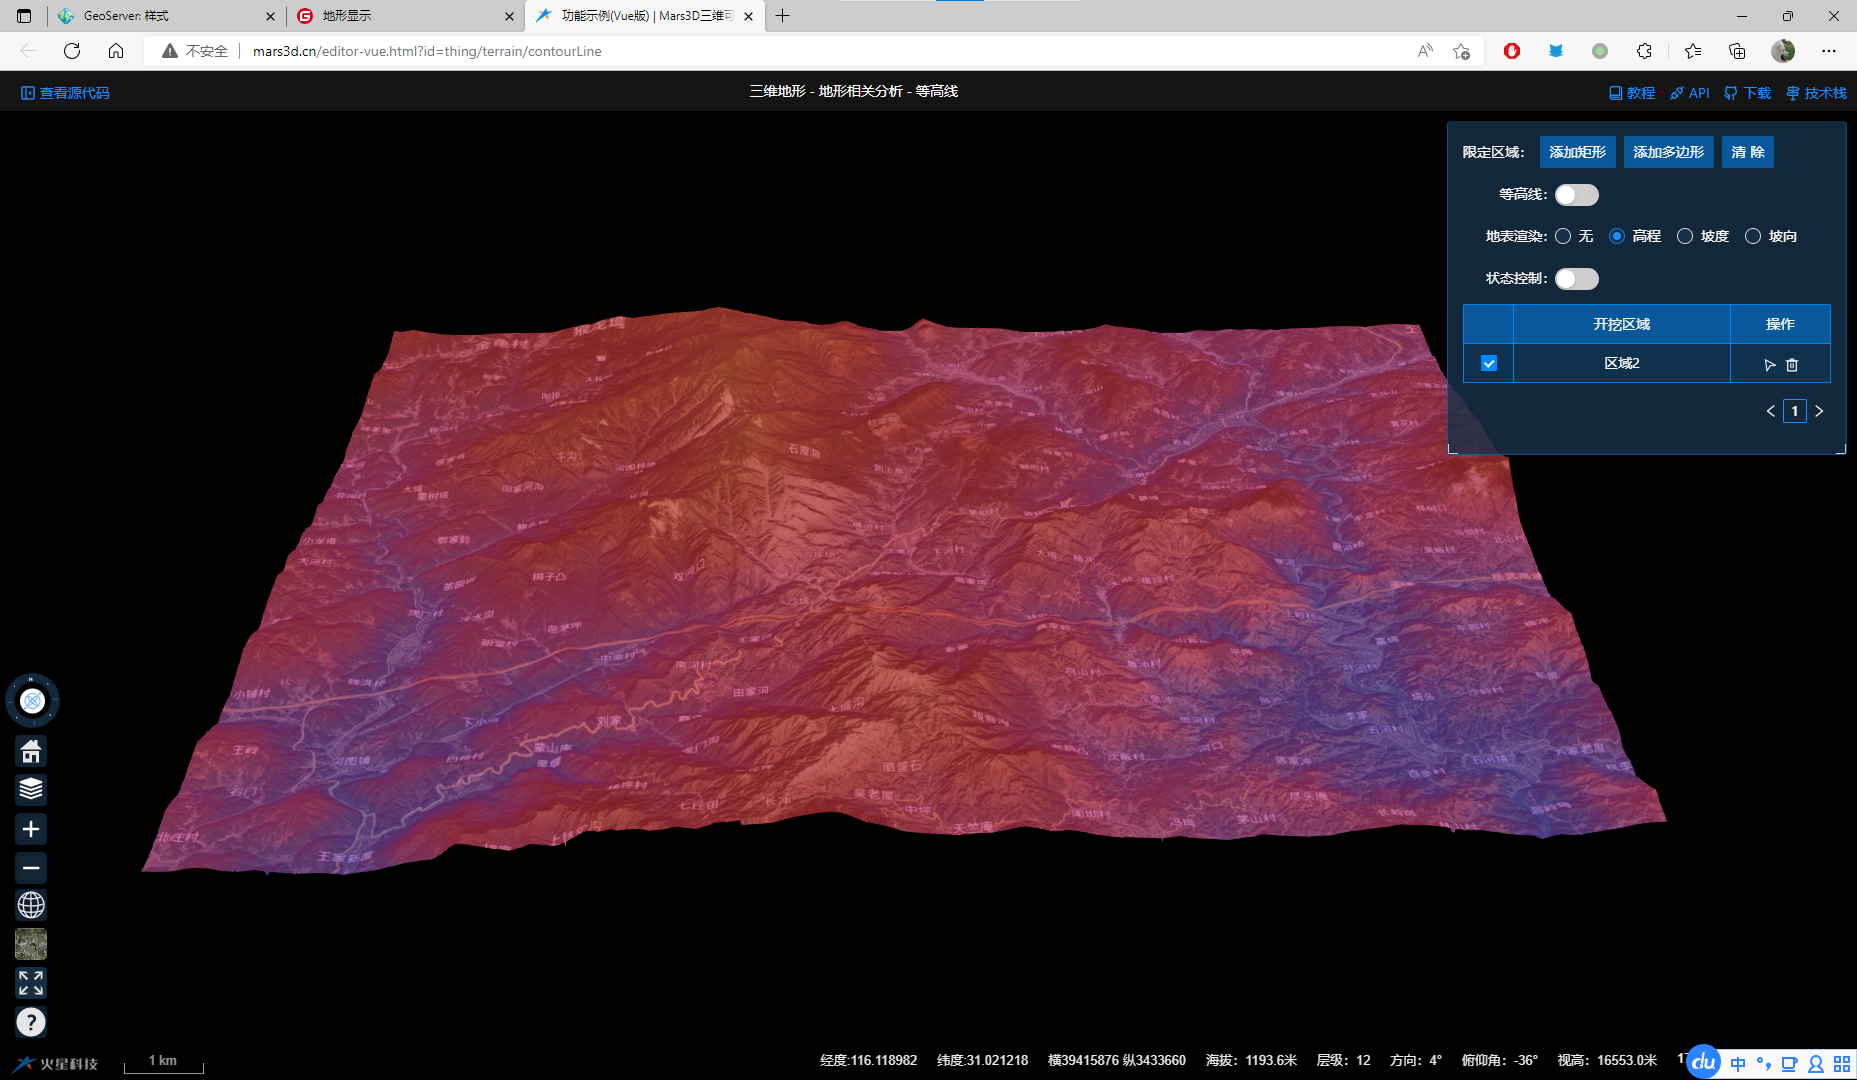
理论上只要支持gltf的webgl库比如three.js等都是可以展示我再上篇文章中生成的地形模型的,我使用的babylon.js,我在之前文章蓝牙Beacon室内定位全栈里有用过,功能比较强大,可以说是一个WebGL的三维引擎也不为过。

babylon.js的使用比较方便,引入babylon.js和加载gltf的babylonjs.loaders.js,使用canvas进行渲染。

<!DOCTYPE html>
<html>
    <head>
        <meta charset="utf-8">
        <meta name="description" content="">
        <meta name="viewport" content="width=device-width, initial-scale=1, shrink-to-fit=no">
        <title>三维地形</title>
        <link rel="stylesheet" media="all" href="./css/index.css">
        <script src="./lib/babylon/babylon.js"></script>
        <script src="./lib/babylon/loaders/babylonjs.loaders.js"></script>
    </head>
    <body>
        <canvas id="renderCanvas"></canvas>
    </body>
    <script src="./js/projection.js"></script>
    <script src="./js/index.js"></script>
</html>

首先初始化引擎和场景

let _canvas,_engine,_scene,_camera;

_canvas = document.getElementById('renderCanvas');
_engine = new BABYLON.Engine(_canvas, true);
_scene = createScene();
_engine.runRenderLoop(function() {
if (_scene.activeCamera) {
_scene.render();
}
});

//创建场景

const createScene = function() {
    const scene = new BABYLON.Scene(_engine);
    _camera = new BABYLON.ArcRotateCamera('camera', Math.PI/2, Math.PI/4, 30, new BABYLON.Vector3(0, 0, 0));
    _camera.inputs.attached.mousewheel.wheelPrecision = 8;
    _camera.inputs.attached.pointers.panningSensibility = 250;
    _camera.inputs.attached.pointers.angularSensibilityX = 5000;
    _camera.inputs.attached.pointers.angularSensibilityY = 5000;
    _camera.attachControl(_canvas, true);
    const light = new BABYLON.HemisphericLight('light', new BABYLON.Vector3(0, 1, 0));
    return scene;
}

在创建引擎和场景的时候,为了方便调试,可以在场景中把坐标轴展示出来,很可惜babylon.js不原生支持坐标轴展示,需要手动画上去。

//创建坐标轴
const showAxis = function (size) {
    const makeTextPlane = function (text, color, size) {
        const dynamicTexture = new BABYLON.DynamicTexture('DynamicTexture', 50, _scene, true);
        dynamicTexture.hasAlpha = true;
        dynamicTexture.drawText(text, 5, 40, 'bold 36px Arial', color, 'transparent', true);
        const plane = new BABYLON.Mesh.CreatePlane('TextPlane', size, _scene, true);
        plane.material = new BABYLON.StandardMaterial('TextPlaneMaterial', _scene);
        plane.material.backFaceCulling = false;
        plane.material.specularColor = new BABYLON.Color3(0, 0, 0);
        plane.material.diffuseTexture = dynamicTexture;
        return plane;
    };

    const axisX = BABYLON.Mesh.CreateLines('axisX', [
        new BABYLON.Vector3.Zero(), new BABYLON.Vector3(size, 0, 0), new BABYLON.Vector3(size * 0.95, 0.05 * size, 0),
        new BABYLON.Vector3(size, 0, 0), new BABYLON.Vector3(size * 0.95, -0.05 * size, 0)
    ], _scene);

    axisX.color = new BABYLON.Color3(1, 0, 0);
    const xChar = makeTextPlane('X', 'red', size / 10);
    xChar.position = new BABYLON.Vector3(0.9 * size, -0.05 * size, 0);
   
    const axisY = BABYLON.Mesh.CreateLines('axisY', [
        new BABYLON.Vector3.Zero(), new BABYLON.Vector3(0, size, 0), new BABYLON.Vector3(-0.05 * size, size * 0.95, 0),
        new BABYLON.Vector3(0, size, 0), new BABYLON.Vector3(0.05 * size, size * 0.95, 0)
    ], _scene);
    axisY.color = new BABYLON.Color3(0, 1, 0);
    const yChar = makeTextPlane('Y', 'green', size / 10);
    yChar.position = new BABYLON.Vector3(0, 0.9 * size, -0.05 * size);
   
    const axisZ = BABYLON.Mesh.CreateLines('axisZ', [
        new BABYLON.Vector3.Zero(), new BABYLON.Vector3(0, 0, size), new BABYLON.Vector3(0, -0.05 * size, size * 0.95),

        new BABYLON.Vector3(0, 0, size), new BABYLON.Vector3(0, 0.05 * size, size * 0.95)

    ], _scene);
    axisZ.color = new BABYLON.Color3(0, 0, 1);
    const zChar = makeTextPlane('Z', 'blue', size / 10);
    zChar.position = new BABYLON.Vector3(0, 0.05 * size, 0.9 * size);

};

加载DEM glb文件

//加载DEM
BABYLON.SceneLoader.LoadAssetContainer('./','asset/dem.glb' , _scene, function (container) {
container.meshes[0].id = '__dem__';
container.meshes[0].name = '__dem__';
container.addAllToScene();
});

毕竟这是一个地理数据,难免需要加一些其他地理数据,因此需要实现坐标转换。这里需要再次说明,之前所有的数据制作流程都是使用的高斯克吕格投影投影,为什么要是用高斯克吕格投影请看我的文章三维GIS建模不要用墨卡托投影,高斯克吕格投影投影和经纬度之间的坐标转换请看我的文章蓝牙Beacon室内定位全栈移动端展示模型部分。单就我这个DEMO来说,还有一点点不同,我使用的坐标系是CGCS2000_3_Degree_GK_Zone_37而不是CGCS2000_3_Degree_GK_CM_111E(两者有啥区别以及为什么会有两种以后有机会再说),加上我们建模的时候不是直接按图像的尺寸来的,有一个缩放,因此在经纬度转成高斯克吕格投影坐标系之后,还需要做一个转换到当前的三维空间坐标,代码如下:

//经纬度转场景坐标
const LngLat2XY = function(lng,lat)
{
    const prjPosition = _projection.LngLat2XY(lng,lat);
    const dx = (prjPosition[0] + 37500000) - _center[0];
    const dy = prjPosition[1] - _center[1];
    const x = dx/_cellSize/100;
    const y = dy/_cellSize/100;
    return [-x,-y]

}

其中_center_cellSize从DEM影像数据的属性信息来。
DEM影像属性

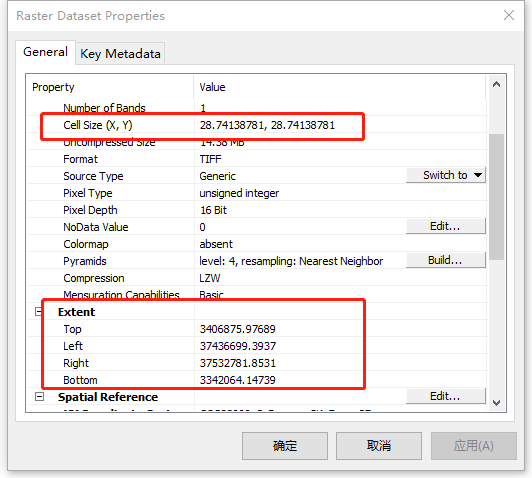
然后我们就可以按位置加入一些模型了,比如

//加载模型

BABYLON.SceneLoader.LoadAssetContainer('./','asset/camera.glb' , _scene, function (container) {
container.meshes[0].id = 'camera_1';
container.meshes[0].name = 'camera_1';
container.meshes[0].scaling = new BABYLON.Vector3(15, 15, 15);
const xy = LngLat2XY(111.288,30.485)
container.meshes[0].position = new BABYLON.Vector3(xy[0], 2, xy[1]);
container.addAllToScene();
const points = [
new BABYLON.Vector3(xy[0], -0.5, xy[1]),
new BABYLON.Vector3(xy[0], 2, xy[1])
];
//位置点虚线
const line = BABYLON.MeshBuilder.CreateDashedLines("camera_line", {
points: points,
dashSize: 50,
gapSize: 25,
dashNb: 10});
line.color = new BABYLON.Color3(0, 0, 1);
});

还可以在上面加Geojson数据,但是我没找到怎么让线贴着地形走的方式。

    const request = new XMLHttpRequest();
    request.open('get','./asset/XZQ.geojson');
    request.send();
    request.onload = ()=>{
        if (request.status == 200) {
            const features = JSON.parse(request.responseText).features
            features.forEach(feature => {
                const coords = feature.geometry.coordinates[0][0]
                const positons = []
                for (let index = 0; index < coords.length; index++) {
                    const coord = coords[index];
                    const xy = LngLat2XY(coord[0],coord[1])
                    positons.push(new BABYLON.Vector3(xy[0], 0.5, xy[1]))
                }
                const xzqLine = BABYLON.MeshBuilder.CreateLines(`xzqLine_${feature.properties.XZQDM}`, {points: positons});
                xzqLine.color = new BABYLON.Color3(1, 1, 1);
            });

        }

    }

我想,既然画上去的线没法贴地,那我可不可以给模型贴材质贴图呢。于是,我把要在上面展示的数据转换坐标系到CGCS2000_3_Degree_GK_Zone_37,通过GeoServer发布成WMS服务,将通过WMS请求回来的图片当做材质贴图贴在模型上。代码如下:

 const url = `${_geoserverUrl}/map/wms?SERVICE=WMS&VERSION=1.1.1&REQUEST=GetMap&FORMAT=image/png&TRANSPARENT=true&STYLES&LAYERS=map:xzq&SRS=EPSG:4525&WIDTH=${_imgSize[0]}&HEIGHT=${_imgSize[1]}&BBOX=${xmin},${ymin},${xmax},${ymax}`
let orgMat = container.meshes[1].material;
orgMat.bumpTexture = new BABYLON.Texture(url, _scene);
orgMat.bumpTexture.vScale = -1

这里需要注意,请求里的WIDTH和HEIGHT要和建模时使用的图片成比例,我是直接使用的原尺寸。请求里面的BBOX的最大值最小值一定要是用DEM影像属性里的范围,不能错。SRS要是用对应的高斯克吕格坐标系,也不能错。

最终效果就如图了。

最终展示效果

加载评论框需要翻墙